
Business-wide problem visibility
See every problem in your business, not just the loud ones.
Kumiko collects problems from every part of your business, classifies each one by how far it actually reaches, and drives the serious ones to root cause. Leadership gets a single view of what is organization wide. Every team keeps its own.
Works for any department. Deploy in your own environment. Runs on your own AI models.
The problem
Escalation is a terrible reporting system
Ask any executive how they find out something is wrong and the honest answer is: somebody tells them. Which means the problems that reach the top are the ones with an advocate, not the ones with a cost.
Underneath, every part of the business keeps its own record in its own way. IT has a ticket queue. Facilities has a shared inbox. Finance has a spreadsheet. Operations has a whiteboard. Customer service has a folder of email threads. None of them talk to each other, and none of them roll up.
So the expensive problem is rarely the dramatic one. It is the small recurring failure that four departments have each quietly absorbed, that nobody escalated because each individual occurrence was survivable, and that nobody can see the shape of because the evidence is spread across five systems in four formats.
Kumiko gives every part of the business one place to report, and gives leadership one place to look. Every problem is classified by reach the moment it arrives, so the organization wide ones surface on their own instead of waiting for somebody to make a case.
The loop
From a two-field report to a countermeasure that holds
Six steps. The first takes about twenty seconds and anyone in the business can do it. The rest happen on the same record, so nothing is re-keyed, re-explained or chased across three systems and somebody’s inbox.
Step 01
Anyone can report it
Somebody picks the part of the business it belongs to and says what happened. Two fields. No category tree, no severity matrix, no questions the person who noticed cannot answer. If reporting is harder than living with the problem, people live with the problem.
Step 02
Classified by reach
The Triage agent reads the description, writes the title, sets the impact (organization wide, department, or individual) and routes it to the team that owns it. The person reporting never sees this step. It simply arrives correctly filed, and leadership can filter on that impact from day one.
Step 03
Get the right people on it
Every problem carries a live thread. The people who own it talk on the record, with read receipts and internal-only notes. The conversation stays attached to the problem instead of scattering across inboxes, chat apps and corridor conversations.
Step 04
Find the cause
Build the fishbone against the six standard categories, People, Process, Equipment, Materials, Measurement and Environment, then drive the five whys until you reach something the business can actually change.
Step 05
Write the A3
Background, current condition, target, the five whys, countermeasures, follow-up. The discipline that makes A3 work, kept as structured fields rather than a document nobody opens again, so it can be searched, compared and reported on across the whole business.
Step 06
Assign and follow up
Each countermeasure becomes a plan item with an owner, a due date and a status. This is the step most improvement programmes skip, and it is the only one that changes what happens next month.
Capabilities
One platform, not five subscriptions
Most businesses run a helpdesk, a chat tool, a project board, a meeting recorder and a shared drive full of half-finished analysis. Kumiko is all of those, joined at the record level, which is the only place the join actually matters.
A collection for every part of the business
IT, facilities, finance, HR, operations, customer service, logistics, retail floor. Each collection has its own owning team, colour and notification address, and can be open to everyone or private to one group. One intake, however many departments you have.
Impact classification, so leaders can filter
Every problem is graded on arrival as organization wide, department level or individual. That single field is what turns thousands of small reports into a leadership view: filter to organization wide and you are looking at the things that actually matter at your level.
Root-cause tooling on the record
Fishbone across six cause categories, five-whys chains, and a full A3 with background, current condition, target, countermeasures and follow-up. Attached to the original report, not filed somewhere separate that nobody opens again.
Cross-department projects
The problems worth fixing rarely sit inside one team. Group related reports from anywhere in the business into a project, give it status columns that match how the work really runs, and track it to completion.
Meetings that leave a record
Schedule the recurring review, run it in the browser, and get an automatic transcript with a summary and extracted key points. What was decided stops depending on who took notes.
A dashboard and a daily brief
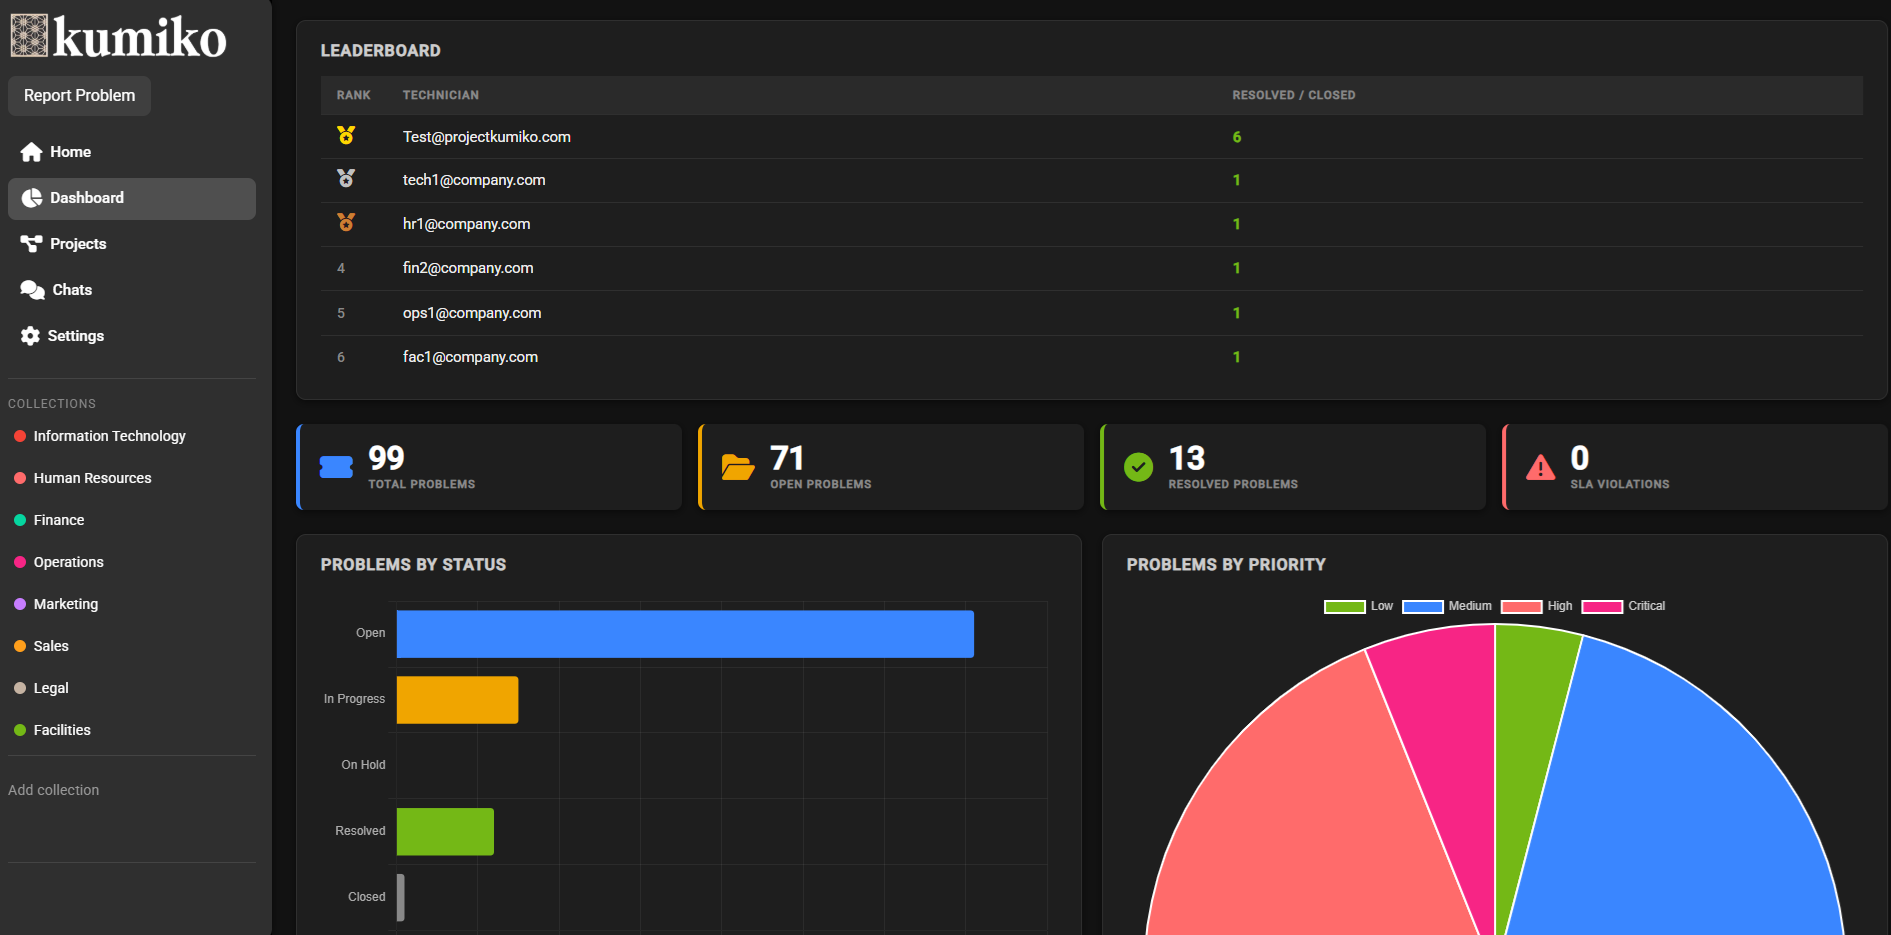
Live figures for volume, impact, priority, status, SLA breaches and workload by person. Plus a brief every afternoon naming what recurred across the business today and the actions that follow from it.
Measurement
Evidence, not anecdote
The dashboard answers the questions that get asked in the management meeting: what is going wrong, in which part of the business, how often, how far it reaches, and whether it is getting better or worse.
- Problems over time, by department, impact, priority and status
- Open, resolved and closed counts at a glance
- SLA breaches surfaced before the review, not during it
- A leaderboard for throughput and workload balancing
- A full audit log on every field that changes, with who and when
Daily summary, sent 5:00 PM
43
Problems today
12
Organization wide
Top recurring problems
- Expenses portal rejects valid receipts · 7
- Meeting room booking double-books · 5
- New starter accounts not ready day one · 4
Illustrative example. Your brief is generated from your own data each afternoon.
Comparison
Kumiko does not replace your departmental tools
Keep your helpdesk, your CRM, your maintenance system. They are built to process work inside one function and they do that well. What none of them can tell you is what is going wrong across the whole business, how far each problem reaches, and why the same things keep coming back. That gap is the whole product.
| Capability | Spreadsheets and inboxes | Single-department tools | Kumiko |
|---|---|---|---|
| Anyone in the business can report in under a minute | Yes, if they know where to send it | Only inside that department | Yes, from any part of the business |
| Automatic triage and routing | No | Rules-based, needs maintaining | Model-driven, no rule tree |
| Fishbone and five whys on the record | On a whiteboard, then nowhere | No, a free-text closing note | Yes, on the original report |
| A3 with owned, dated countermeasures | Yes, but nobody can query it | No | Yes, as structured fields |
| Live thread per problem, across teams | Email chains, if anyone forwards them | Comment fields, not conversation | Yes, with read receipts |
| Reviews recorded, transcribed and summarised | No | No | Yes, in the browser |
| Tells leadership what is recurring, unprompted | Only if someone builds the pivot | Per-department totals, not causes | Daily brief, by department and cause |
| Runs entirely inside your own infrastructure | Yes, trivially | Increasingly cloud-only | Yes, including the AI |
Questions
What people ask before buying
Does this replace our helpdesk or our other departmental systems?
No, and be suspicious of anything that says it does. Your helpdesk, CRM and maintenance system are built to process work inside one function, and they do that well. Kumiko answers the question none of them can: what is going wrong across the whole business, how far does each problem reach, and why do the same things keep coming back. Most customers run both.
How does this give leadership visibility without drowning them?
Every problem is graded on arrival as organization wide, department level or individual. Leadership filters to organization wide and sees perhaps a handful of things a week rather than thousands. Department heads see their own. Nobody is asked to read everything, which is what kills every reporting system that has ever been imposed on a business.
What counts as a collection?
Whatever unit of the business owns problems. Most organizations start with departments: IT, facilities, finance, HR, customer service, operations. Others go by site, by product line, or by process. Each collection has an owning team and a notification address, and can be visible to everyone or private to one group. There is no fixed structure to conform to.
Will people actually use it?
That is the right question, and it kills most rollouts. Kumiko asks for two fields: which part of the business, and what happened. No category tree, no severity matrix, no reference number to look up. Everything else is filled in behind the scenes. If reporting takes longer than working around the problem, people work around the problem, so we made reporting take twenty seconds.
Do our problem descriptions get sent to an AI company?
Only if you choose that. Kumiko talks to any OpenAI-compatible endpoint, which includes a model server on your own network. Set the provider, endpoint and model name and inference stays inside your infrastructure. No vendor to audit, no per-token bill, no data-residency conversation with legal. Hosted providers work too. It is a settings choice, not an architectural one.
Does the AI write our root-cause analysis?
No, deliberately. The AI files the problem, grades how far it reaches, counts what is recurring and writes up the meeting. The fishbone, the five whys and the A3 are done by the people closest to the work. A root cause nobody argued about is a root cause nobody believes, and a countermeasure the team did not choose is one nobody follows.
What happens when the model gets it wrong?
A human corrects it and the correction lands in the audit log. Title, impact and routing are editable fields, not locked decisions. When the model cannot classify something confidently it marks it unclassified rather than guessing, so it goes to a triage queue instead of to the wrong team.
Can we run it on our own infrastructure?
Yes. Kumiko is an ASP.NET Core API with a SQL Server database and a browser front end. It runs on your servers, in your cloud tenancy, or as a deployment we operate for you. Your data lives in your database either way, which matters more than usual here: problem reports are candid, and candid records are exactly the ones you do not want sitting in somebody else’s multi-tenant table.
How long before we see anything?
The technical setup is short: install, connect the database, point it at a mail sender and a model endpoint. The part that takes real time is agreeing what your collections are and who owns each one. Spend a week on that. Badly drawn collections are the single most common reason systems like this go quiet after a month.
What is the problem you do not know about costing you?
Half an hour, your real problems, no slide deck. Bring one issue that keeps coming back and we will walk it through Kumiko end to end: capture, triage, fishbone, A3, countermeasure.
Industrial AI for continuous improvement
Your machines are monitored. Your problems are not.
Kumiko collects the problems your operators, technicians and supervisors hit every shift, classifies each one by how far it actually reaches, and drives the serious ones to root cause. Leadership gets a single view of what is hurting the whole site. Every area keeps its own.
Works across production, maintenance, quality and safety. Deploy inside your own network. Runs on your own AI models.
The problem
The handover is not a reporting system
Ask any plant manager how they find out something is wrong and the honest answer is: somebody told them. Which means the problems that reach the top are the ones with an advocate, not the ones with a cost.
Underneath, every area keeps its own record in its own way. Maintenance has a work order queue. Quality has a folder of non-conformance reports. Safety has a near-miss form. Production has a whiteboard and a shift log. Engineering has an inbox. None of them talk to each other, and none of them roll up.
So the expensive problem is rarely the breakdown that took the line out for a day. It is the four-minute stop on the same machine every shift that nobody raises because clearing it is quicker than reporting it, that nobody escalated because each individual occurrence was survivable, and that nobody can see the shape of because the evidence is spread across five systems and three notebooks.
Kumiko gives every area of the site one place to report, and gives leadership one place to look. Every problem is classified by reach the moment it arrives, so the ones that affect the whole site surface on their own instead of waiting for somebody to make a case.
The loop
From a two-field report to a countermeasure that holds
Six steps. The first takes about twenty seconds and anyone on shift can do it. The rest happen on the same record, so nothing is re-keyed, re-explained or chased across three systems and somebody’s inbox.
Step 01
Anyone on shift can report it
An operator picks the area it belongs to and says what happened. Two fields. No fault code list, no severity matrix, no questions the person who saw it cannot answer. If reporting is harder than working around the problem, people work around the problem.
Step 02
Classified by reach
The Triage agent reads the description, writes the title, sets the impact (organization wide, department, or individual) and routes it to the team that owns it. The operator never sees this step. It simply arrives correctly filed, and the plant manager can filter on that impact from day one.
Step 03
Get the right people on it
Every problem carries a live thread. Production, maintenance and quality talk on the record, with read receipts and internal-only notes. The conversation stays attached to the problem instead of scattering across radios, chat groups and the shift handover.
Step 04
Find the cause
Build the fishbone against the six standard categories, People, Process, Equipment, Materials, Measurement and Environment, then drive the five whys until you reach something the site can actually change. The 6M your CI team already works to, on the record rather than on a flipchart.
Step 05
Write the A3
Background, current condition, target, the five whys, countermeasures, follow-up. The discipline that makes A3 work, kept as structured fields rather than a document nobody opens again, so it can be searched, compared and reported on across the whole site.
Step 06
Assign and follow up
Each countermeasure becomes a plan item with an owner, a due date and a status. This is the step most CI programmes skip, and it is the only one that changes what happens on the next shift.
Capabilities
One platform, not five systems and a notebook
Most sites run a maintenance system, a quality system, a chat group, a spreadsheet of open actions and a shared drive full of half-finished analysis. Kumiko replaces none of them. It is the problem record none of them keep: one intake for the whole site, one thread per problem, one root-cause trail, joined at the record level.
A collection for every area of the site
Production, maintenance, quality, safety, warehouse, tooling, facilities. Each collection has its own owning team, colour and notification address, and can be open to everyone or private to one group. One intake, however many areas you run.
Impact classification, so leadership can filter
Every problem is graded on arrival as organization wide, department level or individual. That single field is what turns a whole shift of small reports into a leadership view: filter to organization wide and you are looking at what is hurting the whole site, not one cell.
Root-cause tooling on the record
Fishbone across the six standard cause categories, five-whys chains, and a full A3 with background, current condition, target, countermeasures and follow-up. Attached to the original report, not photographed off a flipchart and lost.
Cross-area projects
The problems worth fixing rarely sit inside one team. Group related reports from anywhere on site into a project, give it status columns that match how the work really runs, and track it to completion.
Meetings that leave a record
Schedule the weekly CI review, run it in the browser, and get an automatic transcript with a summary and extracted key points. What was decided stops depending on who took notes.
A dashboard and a daily brief
Live figures for volume, impact, priority, status, SLA breaches and workload by person. Plus a brief every afternoon naming what recurred across the site today and the actions that follow from it.
Measurement
Evidence, not anecdote
The dashboard answers the questions that get asked in the morning meeting: what is going wrong, in which area, how often, how far it reaches, and whether it is getting better or worse.
- Problems over time, by area, impact, priority and status
- Open, resolved and closed counts at a glance
- SLA breaches surfaced before the review, not during it
- A leaderboard for throughput and workload balancing
- A full audit log on every field that changes, with who and when
Daily summary, sent 5:00 PM
43
Problems today
12
Organization wide
Top recurring problems
- Line 3 infeed jams after changeover · 7
- Palletiser stops on a misread label · 5
- Torque gun drifts out of calibration mid-shift · 4
Illustrative example. Your brief is generated from your own data each afternoon.
Comparison
Kumiko does not replace your maintenance or quality system
Keep your maintenance system, your quality system, your ERP. They are built to process work inside one function and they do that well. What none of them can tell you is what is going wrong across the whole site, how far each problem reaches, and why the same things keep coming back. That gap is the whole product.
| Capability | Shift logs and spreadsheets | CMMS, QMS and ERP | Kumiko |
|---|---|---|---|
| Anyone on site can report in under a minute | Yes, if they know where to send it | Only with a licence and training | Yes, from anywhere on site |
| Automatic triage and routing | No | Rules-based, needs maintaining | Model-driven, no rule tree |
| Fishbone and five whys on the record | On a flipchart, then nowhere | No, a free-text closing note | Yes, on the original report |
| A3 with owned, dated countermeasures | Yes, but nobody can query it | No | Yes, as structured fields |
| Live thread per problem, across areas | The radio, and the shift handover | Comment fields, not conversation | Yes, with read receipts |
| Reviews recorded, transcribed and summarised | No | No | Yes, in the browser |
| Tells the plant what is recurring, unprompted | Only if someone builds the pivot | Per-asset totals, not causes | Daily brief, by area and cause |
| Runs entirely inside your own network | Yes, trivially | Increasingly cloud-only | Yes, including the AI |
Questions
What people ask before buying
Does this replace our CMMS or our quality system?
No, and be suspicious of anything that says it does. Your maintenance system, quality system and ERP are built to process work inside one function, and they do that well. Kumiko answers the question none of them can: what is going wrong across the whole site, how far does each problem reach, and why do the same things keep coming back. Most customers run both.
Does it connect to our machines, our PLCs or our historian?
No. Kumiko records what people see, not what sensors measure, and that is the point rather than a gap. Condition monitoring already tells you the bearing is running hot. Nothing tells you that an operator has been clearing the same infeed jam four times a shift for six months because clearing it is quicker than raising a work order. No amount of telemetry closes that gap, because the data was never captured in the first place.
How does this give leadership visibility without drowning them?
Every problem is graded on arrival as organization wide, department level or individual. Leadership filters to organization wide and sees perhaps a handful of things a week rather than everything raised on every shift. Area leads see their own. Nobody is asked to read everything, which is what kills every reporting system that has ever been imposed on a site.
What counts as a collection?
Whatever unit of the site owns problems. Most plants start with areas: production, maintenance, quality, safety, warehouse, facilities. Others go by line, by cell, or by product family. Each collection has an owning team and a notification address, and can be visible to everyone or private to one group. There is no fixed structure to conform to.
Will operators actually use it?
That is the right question, and it kills most rollouts. Kumiko asks for two fields: which area, and what happened. No fault code list, no severity matrix, no work order number to look up. Everything else is filled in behind the scenes. If reporting takes longer than working around the problem, people work around the problem, so we made reporting take twenty seconds.
Do our problem descriptions get sent to an AI company?
Only if you choose that. Kumiko talks to any OpenAI-compatible endpoint, which includes a model server sitting on your own network. Set the provider, endpoint and model name and inference stays inside your infrastructure. No vendor to audit, no per-token bill, no data-residency conversation with legal. Hosted providers work too. It is a settings choice, not an architectural one.
Does the AI write our root-cause analysis?
No, deliberately. The AI files the problem, grades how far it reaches, counts what is recurring and writes up the meeting. The fishbone, the five whys and the A3 are done by the people closest to the work, which on a plant means the people who run the line. A root cause nobody argued about is a root cause nobody believes, and a countermeasure the team did not choose is one nobody follows.
What happens when the model gets it wrong?
A human corrects it and the correction lands in the audit log. Title, impact and routing are editable fields, not locked decisions. When the model cannot classify something confidently it marks it unclassified rather than guessing, so it goes to a triage queue instead of to the wrong team.
Can we run it on our own infrastructure?
Yes. Kumiko is an ASP.NET Core API with a SQL Server database and a browser front end. It runs on your servers, in your cloud tenancy, or as a deployment we operate for you. Your data lives in your database either way, which matters more than usual here: problem reports from the floor are candid, and candid records are exactly the ones you do not want sitting in somebody else’s multi-tenant table.
How long before we see anything?
The technical setup is short: install, connect the database, point it at a mail sender and a model endpoint. The part that takes real time is agreeing what your collections are and who owns each one. Spend a week on that. Badly drawn areas are the single most common reason systems like this go quiet after a month.
What is the stoppage nobody has logged costing you?
Half an hour, your real problems, no slide deck. Bring one issue that keeps coming back on your site and we will walk it through Kumiko end to end: capture, triage, fishbone, A3, countermeasure.